|
Examples - Web Service Widgets |
Below are examples of Dashboard widgets created for each Web Service type: Query, Chart, Report and Maintenance.
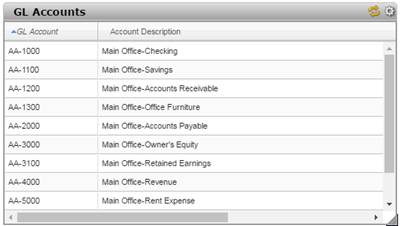
The Query Service displays a list containing data from one or more linked files.
(Column sorting and table capability for Query Web Service were added in PxPlus 2016.)
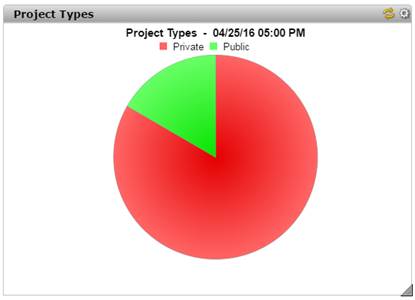
The Chart Service displays a defined chart.
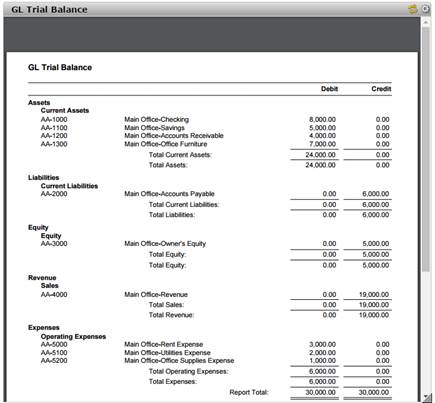
The Report Service displays the contents of a defined Report Writer report.
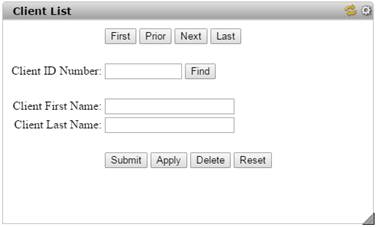
The Maintenance Service generates an HTML form for user input with fields from a specified data table.
The generated form also includes the following:
|
First, Prior, Next, Last buttons |
Used for browsing through inputted records, if they exist. |
|
Find button |
Uses the value entered in the Key field to locate a particular record. |
|
Submit button |
Updates the record and then clears the input fields. |
|
Apply button |
Creates the record but does not clear the input fields. |
|
Delete button |
Removes the record. |
|
Reset button |
Cancels any changes to the current record and then clears the input fields. |
The fields are initially loaded with any default values defined in the data dictionary. If information is missing for a required field, a message displays when the Submit or Apply button is selected.