1.
You will need a Web server to interface with the browser so Launch EZWeb Server. Take note of the Port Number you are using as this will be used in the next steps. In this example, you will launch locally on Port 8080.
2.
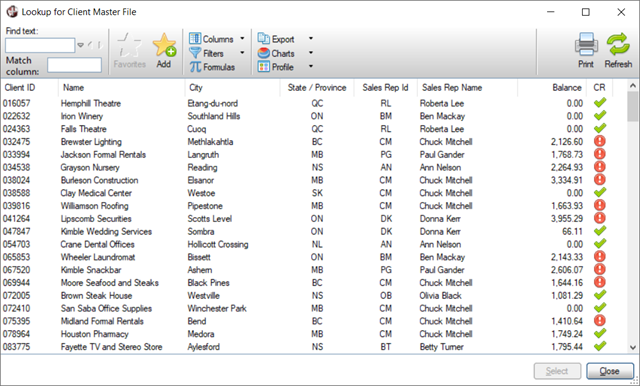
Invoke Web Services Maintenance to define a Service ID and parameters for the items to be displayed. In this example, Service IDs will be created for the QClient query, the Sales by Sales Rep chart definition and the SalesRepClients.pvr report.
3.
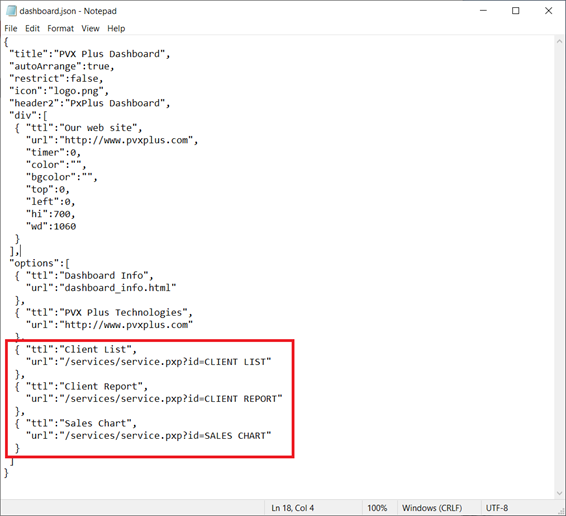
Invoke Configure Dashboard and edit dashboard.json to add the items to the dashboard options. Use the Service ID to set up the URL for the items.
Example:
{ "ttl":"Client List",
"url":"/services/service.pxp?id=CLIENT LIST"
},
4.
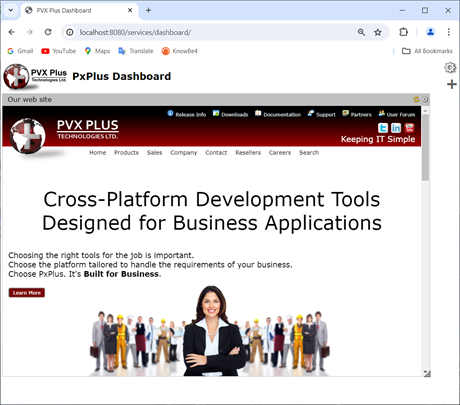
Invoke the PxPlus Dashboard in your browser. The syntax for loading the dashboard is http://your.website.com/services/dashboard. Since you are running locally on Port 8080, the URL for this example is http://localhost:8080/services/dashboard/. Once the dashboard is loaded, you can load the widgets.
5.
The sample PxPlus Dashboard comes with a PVX Plus Technologies widget displaying our Web site.
You can move this down by clicking the Gear button in the top right of the browser window and turning off the Auto Arrange option.
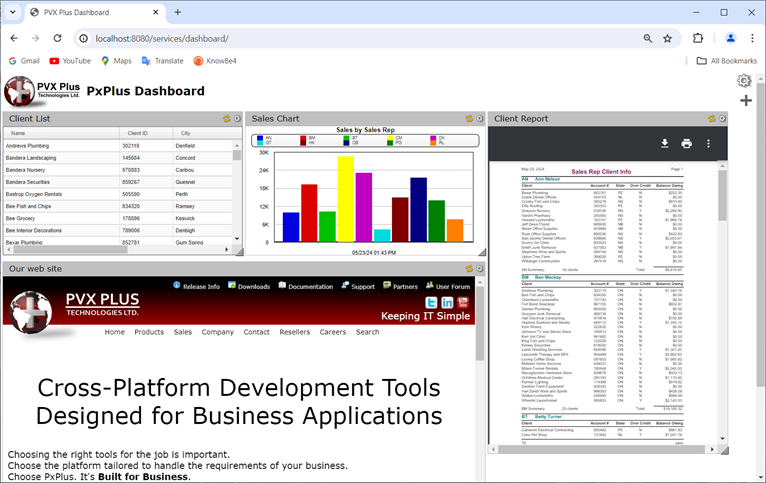
Then, click the + (plus sign) below the Gear button three times to add new widgets. Arrange and size them.
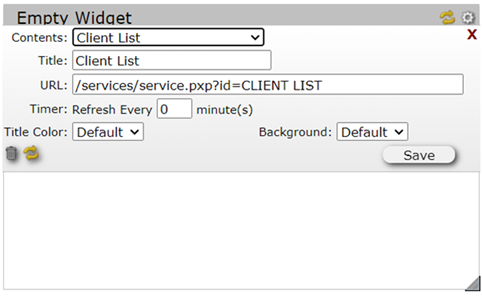
Click the Gear button at the top of the widget to define the content of the widget. The Contents list should now contain the Service IDs you created in Step 2. Select one of the IDs for each widget.
When the content is assigned, click the Save button, and the widget will be automatically populated.
