|
Chart Control |
|
CHART ctl_id, @(col,ln,wth,ht) ,[, ctrlopt ]
CHART { REMOVE | DISABLE | ENABLE } ctl_id
CHART { HIDE | SHOW } ctl_id
CHART LOAD ctl_id, strvar$
CHART CLEAR ctl_id
CHART DELETE ctl_id
CHART FIND ctl_id, dataset, point, { numvar | label$ }
CHART READ ctl_id, dataset,eom$
CHART WRITE ctl_id, dataset,point, { numvar | label$ }
The charting control feature in PxPlus can be used to create a variety of chart illustrations with 2D or 3D effects. This object type is generally for display purposes only and responds to few events. Available chart types include Area, Bar, Column, Line, Pie, Ribbon, Scatter and Stack. For syntax details, see CHART directive.
For information on adding a chart to a panel using the NOMADS Panel Designer, see Chart Control.
For a list of properties that can be applied to a chart, see Chart Properties.
Example:
! Chart example
BEGIN
PRINT 'CS',
FOR I=1 TO 2
GOSUB Draw_Chart
NEXT
INPUT @(5,22),"Press any key to end",*,'CS',
END
Draw_Chart:
IF i=1 \
THEN c=10,x=5,format$="3DCOLUMN" \
ELSE c=20,x=42,format$="2DCOLUMN"
CHART c,@(x,3,32,18),FMT=format$,SEP=","
c'indexmode=1
c'AutoScale=1,c'font$="Arial,-10,I"
c'BackColour$="Light Gray"
c'LegendLocation$="Right"
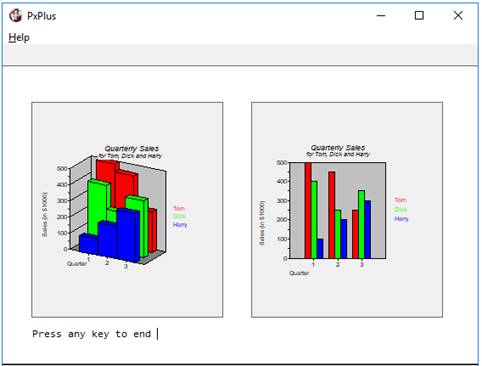
c'Title1$="Quarterly Sales",c'Title2$="for Tom, Dick and Harry"
c'xAxisTitle$="Quarter",c'yAxisTitle$="Sales (in $1000)"
CHART LOAD c,"Tom=500,450,250/Dick=400,250,350/Harry=100,200,300/"
RETURN
This example creates two- and three-dimensional charts, using properties to add legends, change font and colours, as well as other display attributes.