|
How to Include Bar Charts in List Boxes |
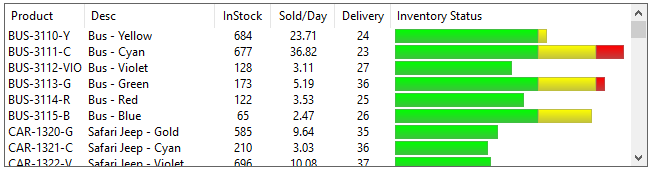
PxPlus provides the ability to include Bar Charts within formatted List Boxes. This functionality allows you to present a more visual representation of the data, such as sales statistics, usage and other numerical information.
Adding Bar Charts to formatted List Boxes is done by using the 'FILL' mnemonic to define the column contents. The 'FILL' mnemonic, when used in a List Box, defines the percentage of the column that you want filled and the color.
Example:
'FILL'(50,"Yellow") will fill 50% of the column width with the color Yellow.
If you want multiple bars, simply include multiple 'FILL' mnemonics.
If desired, you may also include standard text in the column contents that will be placed according to its position to the 'FILL' mnemonics. If the total percentage filled plus the text exceeds 100%, the contents will be truncated. If you want to make sure that any text following the Bar Chart is displayed, keep the total filled less than 100%.
Example:
Below is a simple program that uses some hard-coded data to show how you can create this type of Bar Chart.
lv=10
list_box lv,@(2,5,76,12),fmt="[Product]10C [Desc]15 [QOH]5C [Sold/Day]7C [Delivery]7c [Inventory Status]30",opt="r"
!
loaddata$=""
!
while 1
read data productcode$,description$,qtyonhand,soldperday,delivery,end=*break
!
delivery=14+rnd(30)
status=50+rnd(800)/10
soldperday=(status*qtyonhand)/(delivery*100)
!
! Compute likely state based on sales per day versus delivery time
!
! Status > 100 means Delivery time exceeds day's supply
! We want
!
! status <= 80 to indicate good status (Green)
! status between 80->100 indicates marginal (Yellow)
! status over 100 indicates bad status (Red)
!
! We divide all these numbers by 1.3 to allow for worst case status of 130
!
dayssupply=qtyonhand/soldperday
status=(delivery*100)/dayssupply
!
thebar$='fill'(min(80,status)/1.3,"GREEN") ! Show % good status
thebar$+='fill'(min(20,status-80)/1.3,"YELLOW") ! Show % marginal
thebar$+='fill'(min(30,status-100)/1.3,"RED") ! Show % bad
!
loaddata$+=rec(iol=lv_iol)+$01$
wend
!
list_box load lv,loaddata$
escape
!
lv_iol: \
iolist productcode$,description$,qtyonhand,soldperday,delivery,thebar$
!
data "BUS-3110-YLW","Bus - Yellow",684,12.89,32
data "BUS-3111-CYN","Bus - Cyan",677,10.98,42
data "BUS-3112-VIO","Bus - Violet",128,3.65,36
data "BUS-3113-GRN","Bus - Green",173,4.21,41
data "BUS-3114-RED","Bus - Red",122,3.92,37
data "BUS-3115-BLU","Bus - Blue",65,3.24,18
data "CAR-1320-GLD","Safari Jeep - Gold",585,18.75,37
data "CAR-1321-CYN","Safari Jeep - Cyan",210,7.69,35
data "CAR-1322-VIO","Safari Jeep - Violet",696,21.18,42
data "CAR-1323-GRN","Safari Jeep - Green",235,5.72,25
data "CAR-1324-RED","Safari Jeep - Red",665,27.43,29
data "CAR-1325-BLU","Safari Jeep - Blue",543,14.39,34
data "CAR-1410-SLV","Bug - Silver",487,15.03,30
data "CAR-1411-ROS","Bug - Pale Rose",550,25.09,21
data "CAR-1412-SEA","Bug - Seagreen",594,16.79,41
data "CAR-1413-VIO","Bug - Violet",105,2.21,29
data "CAR-1414-PRL","Bug - Pearl",376,11.56,32
data "CAR-1415-WHT","Bug - White",151,2.64,39
data "CAR-2220-PNK","Cabriolet - Fuschia",665,47.84,15
data "CAR-2221-LME","Cabriolet - Lime",542,14.31,33
Adding Colors
If desired, you can specify two colors in the 'FILL' mnemonic. When providing two colors, the first color will be the color used at the top of the bar blending down to the second color.
If only one color is given, the system will attempt to shade it slightly with a lighter shade on the top and a darker shade on the bottom.
Using Grids
Grids can also include horizontal bars in cells by setting the Cell Type to BarChart and setting the cell's 'Text$ property to the percentage to fill and the colors desired.
Horizontal Bar Charts in Grid Cells