|
Query Definition |
|
Query contents are defined in the Query Definition window. This window is used to set up link files, define columns, edit the Query Header and set up selection criteria. After the query is defined, it can be tested and saved.
When creating a new query, the Query Definition window is launched after defining the Query Header. When selecting an existing query in Library Object Selection, the Query Definition window is launched to show the query contents.
The Query Definition window can also be accessed in the NOMADS Panel Designer when Assigning a Query to a List Box, Drop Box, Multi-Line or Grid control.
The Query Definition window consists of the following:
|
Displays a list of files (the main data file/table and any defined link files) and their elements. Icons next to each element indicate whether the field is a string, numeric or date (i.e. DATE class) field. (Manual files have no elements listed.) Array elements are displayed with their dimensions in braces; e.g. Month${1:12}. Items can be selected from this list for addition to the Columns list for display in the query. Select an item by double-clicking on it, by highlighting it and clicking a selection button, or by selecting the Add option from the right-click popup menu associated with the item. Popup menus associated with the main file and cross-reference files also allow you to add fields from the respective files. When an array is added as part of an "add all fields" or "add all fields in file" scenario, all the elements in the array are automatically added to the Columns list. If the array alone is selected from the File Elements list, the Select Array Element window is displayed to allow you to select all elements or select a single array element by specifying its subscripts. This window consists of the following:
(Support for array elements in the query was added in PxPlus 2022.) | |||||||||||||
|
Displays a list of columns selected from the File Elements list. Columns can be a simple element (i.e. field/column name such as InvoiceNumber) or a formula (i.e. a PxPlus expression). When a file element is initially added to the Columns list, default characteristics (such as title, column width, format, etc.) are set. These can be modified later using the Column Options window or by double-clicking the column item. When defining a new query, the Columns list is automatically populated with fields that make up the chosen key, if available, as well as the first non-key field that is 15 or more characters long. (This feature is not available to queries built with manually defined files.) (Support for automatically populating the Columns list with the primary key(s) and next field was added in PxPlus 2024.) | |||||||||||||
|
Selection Buttons |
The selection buttons between the lists are used to add all or only selected items from the File Elements list to the Columns list. They are also used to remove all or only selected items from the Columns list. For manual files, select a file and click the selection button to invoke the Column Options window where you can manually define the column to add. | ||||||||||||
|
Select as 'Hidden' |
When this check box option is selected, any items selected from the File Elements list are added to the Columns list as initially hidden; i.e. the column is initially hidden at run time until the user selects it to be shown. This option can also be toggled for a specific element by right clicking on the element in the Columns list and selecting the Hide/Show option or by using the Column Options window. When using Query+ Toolbar, Hybrid, Menu or Drop Query views (see Query View option), columns can be set to be initially hidden or shown by clicking the Test/Design toolbar button to display the query and selecting the Show/Hide/Reorder Columns item from the Columns run-time option to set the column visibility. Click the Save + Exit button to save and incorporate these settings into the query definition when exiting the query. (The ability to save query changes when in Test/Design mode was added in PxPlus 2023 Update 1.) | ||||||||||||
|
(Query+, Not Applicable to Drop Tree Query) Click the link to invoke the Select Column Sort Order window to specify a column to sort by (ascending or descending) after the query is loaded. This overrides the default sort sequence, which is determined by the key selection in the query header. The column sort affects the initial load only; subsequent reloads will maintain the last column sort used in the query. This window consists of the following:
Note:
| |||||||||||||
|
Move Up |
Buttons (below the Columns list) that are used to change the order of the items in the Columns list. The order of the columns can also be set for Query+ Toolbar, Hybrid, Menu or Drop Query views (see Query View option) by clicking the Test/Design toolbar button to display the query and selecting the Show/Hide/Reorder Columns item from the Columns run-time option to reorder the columns. Click the Save + Exit button to save and incorporate these settings into the query definition when exiting the query. (The ability to save query changes when in Test/Design mode was added in PxPlus 2023 Update 1.) | ||||||||||||
|
Close |
Exits the Query Definition window. If any unsaved changes are detected, you will be prompted to save the changes. (The Close button was added in PxPlus 2019 Update 1.) |
The Query Definition toolbar consists of the following functions:
|
Save |
Saves the current query definition. (If the session terminates abnormally without saving, the unsaved changes can be recovered the next time you load the definition.) |
|
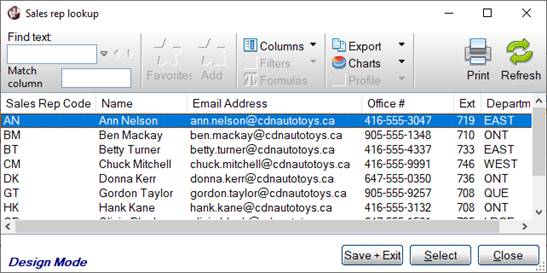
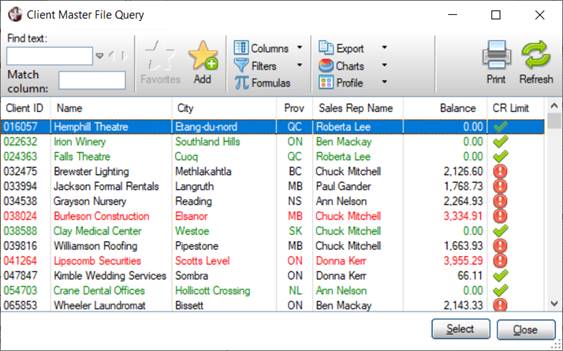
(Classic Query and Query+ Drop Tree Query) Tests the current query definition. (Query+ Toolbar, Hybrid, Menu and Drop Query) When testing the query, many of the run-time features are disabled, such as Favorites, Filters, Formulas and Profiles. See Run-Time Query. The Columns feature is enabled to allow the developer to use the Show/Hide/Reorder Columns option to initially show and hide and reorder the columns. Column widths can also be adjusted by dragging the edge of the column header to the desired width. The size of the query panel itself (except for the Drop Query) can also be resized by dragging the edges of the panel. These new settings can be saved and incorporated into the query definition by clicking the Save + Exit button when exiting the query. Be sure to save the current query definition to ensure that all changes are saved. Example: Below is an example of a query displayed in Test/Design mode: (The Test/Design button was added in PxPlus 2023 Update 1.) | |
|
Header |
Launches the Query Header Definition window for editing header information. |
|
Filter |
Launches the Query Selection Criteria window for setting up selection criteria. |
|
Security |
Launches the Object Security Definition window for setting up top-level security for the query. See Query Security. (The Security button was added in PxPlus 2021.) |
|
|
Prints the details of the query definition. |
|
Add Link |
Click the Add Link button to launch the Query File Link window for adding a link to a cross-reference file. To modify an existing link, highlight the name of the link file in the File Elements list and then click the Update Link button to launch the Query File Link window. To remove an existing link, highlight the name of the link file in the File Elements list and then click the Remove Link button. |
|
Column Options |
Launches the Columns Options window for defining the column title, width, format, etc., as well as the Field Definition for manually defined files. |
|
Add Formula |
Launches the Query Formula Definition window for adding or modifying a formula. |
|
(Available when Show Query+ Options check box AND one or more Columns are selected) Launches the Chart Wizard for defining simple charts based on the columns of a query. The results are public developer AutoChart definitions that can be used to generate and load data into a Smart Chart. See Smart Controls. (The Define Chart button was added in PxPlus 2019.) | |
|
Show Query+ Options |
When selected, only query options available to Query+ displays are enabled. In addition, the Test button will generate a Query+ panel. If not selected, options and test display will be those of the Classic Query. For information on the modes of query display, see Query Subsystem. Note: |
The Query Definition menu bar consists of a Projects menu with the following selections:
|
Projects |
Lists options for projects:
| ||||
|
Quit |
Closes the Query Definition window. If any unsaved changes are detected, you are prompted to save the changes. |
Query File Link
Column Options
Query Formula Definition
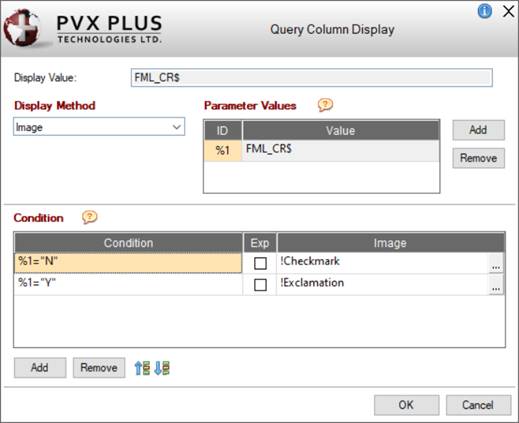
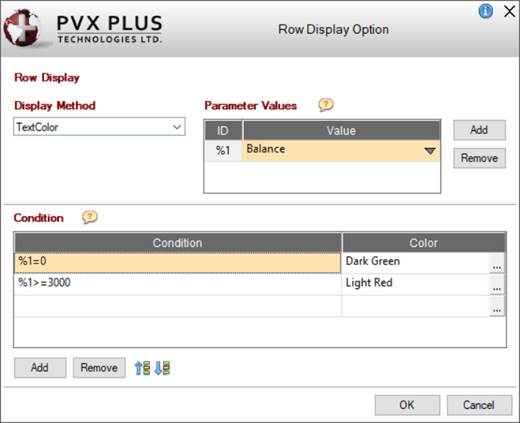
Defining Query Column and Row Display