|
Schedule the Chart Generation |
|
The second step is to schedule the chart generation. To generate a chart image, the chart definition or program is added to the Chart Scheduler. The Chart Scheduler allows you to schedule chart image generation either on a fixed schedule or an on-demand basis. Entries can be added, modified or deleted in the Chart Scheduler by accessing Chart Image Generation Schedule Maintenance.
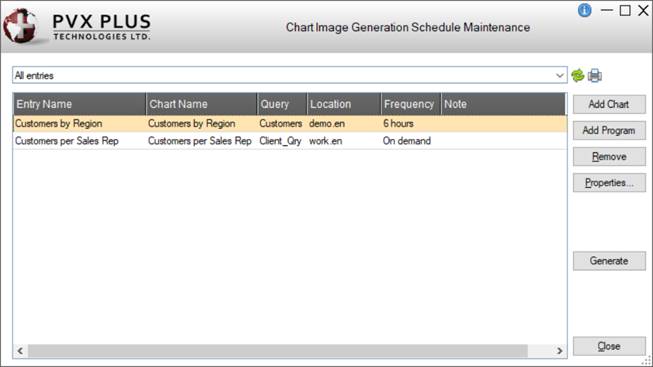
The Chart Image Generation Schedule Maintenance utility displays a list of all scheduled entries that have been added, as indicated by the All entries selection in the drop box above this list. In addition to adding, changing or removing entries, you can refresh the list, view a report showing schedule details of all listed items, and generate a chart image on demand.
(Chart Image Generation Schedule Maintenance was added in PxPlus v11.50.)
The Chart Image Generation Schedule Maintenance window can be accessed by using various methods, and the particular method used determines the level of information presented.
For example, you can invoke the general maintenance window (above), which shows a list of all schedule entries, from the PxPlus IDE Main Launcher. To do this, first expand the Graphical Application Builder (NOMADS) category, and then expand the Utilities category. Under the Utilities category, select Chart Image Scheduler. Another method is to select Chart Image Scheduler from the Utilities menu on the NOMADS Session Manager window.
More specifically, you can first select a library from within NOMADS, and then in Library Object Selection, select Chart Image Scheduler from the Utilities menu to display schedule entries only for that library.
Chart Image Generation Schedule Maintenance can also be invoked from your application when a query is invoked. If the query has public chart definitions associated with it, the Schedule Chart Image Generation option appears on the popup menu, and the Chart Image Generation Schedule Maintenance utility will display any entries associated with that query.
Another method for accessing the Chart Image Generation Schedule Maintenance utility is by using the CHARTSCHED command line program. It can be invoked from the Command line at several levels:
|
Command |
Description |
|
chartsched |
General maintenance based on current directory and subdirectories |
|
chartschedDirectory |
Maintenance for all schedule items for the specified directory and subdirectories |
|
chartschedLibrary |
Maintenance for all schedule items for the specified library |
|
chartschedLibrary,QueryPanel |
Maintenance for all schedule items for the specified query |
|
chartschedScheduleEntryName |
Item maintenance for the specified item |
Using Chart Image Generation Schedule Maintenance, you can add both AutoChart definitions and program references to the schedule.
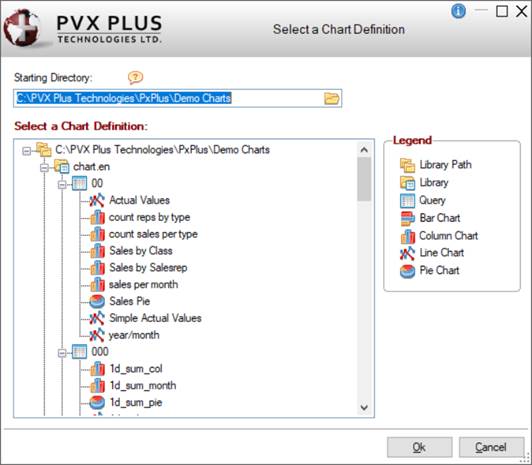
To add an AutoChart definition to the schedule, click the Add Chart button in Chart Image Generation Schedule Maintenance. Depending on the method used to invoke this utility, a tree-view structure lists all of the public AutoChart definitions that exist at the current display level and lower.
At the general maintenance level, you can specify a Starting Directory, which is used as the top level of the tree-view structure. Selecting a Chart Definition from this display opens the Chart Scheduler window.
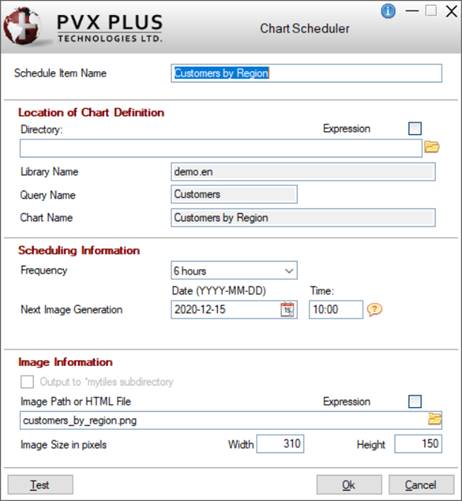
For a chart schedule entry, the Chart Scheduler requires the following information:
|
Schedule Item Name |
Unique name used to identify each schedule entry. The name is initially derived from the name of the chart definition; however, this can be changed. | ||||||||||||||||
|
Location of Chart Definition |
| ||||||||||||||||
|
Scheduling Information |
| ||||||||||||||||
|
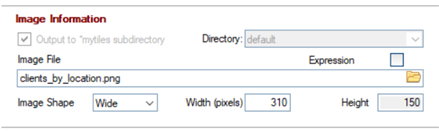
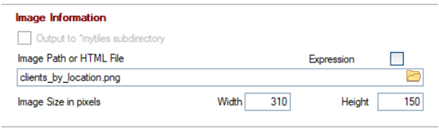
Image Information |
|
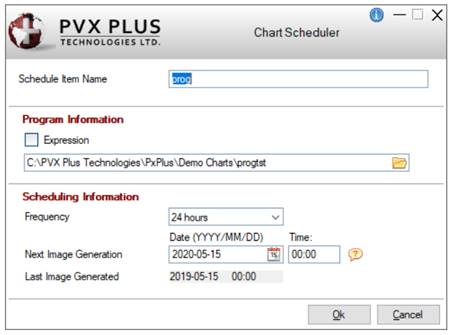
Chart images can also be created by writing a program to create the chart and its image. To add this type of chart to the Chart Scheduler, click the Add Program button in Chart Image Generation Schedule Maintenance. A modified version of the Chart Scheduler is displayed.
For a chart schedule entry using a program, the Chart Scheduler requires the following information:
|
Schedule Item Name |
Unique name used to identify each schedule entry. The name is initially derived from the name of the chart definition; however, this can be changed. | ||||||
|
Program Information |
| ||||||
|
Scheduling Information |
|
From the list of schedule entries displayed in Chart Image Generation Schedule Maintenance, click to highlight the schedule entry to be deleted and select the Remove button.
From the list of schedule entries displayed in Chart Image Generation Schedule Maintenance, click to highlight the schedule entry to be modified and select the Properties button. The Chart Scheduler window opens with the information for the selected entry displayed for editing.