|
Defining Query Column and Row Display |
Visual attributes, such as bold text, text color or highlight color, can be assigned to a query column or a row in the query data list. The various visual attributes can be assigned based on specified conditions being met. A query column can also display images or percent bars.
For example, percent bars can be assigned to a column to show the percentage of sales achieved by each salesperson. Text colors can be assigned to a query row to show Red text or Green text based on a specified condition being met.
In the query example below, text colors have been assigned to the query row to show Red text if a value in the Balance column is equal to or greater than 3000.00 or Green text if the value equals 0.00. Images have been assigned to the CR Limit column to show a check mark or an exclamation based on whether a client's Credit Limit has been exceeded.
Visual attributes for a query column are defined by using Query Column Display.
Visual attributes for a query row are defined by using Row Display Option.
For examples of column and row display scenarios that can be defined, see Column Display Examples and Row Display Examples.
The Query Column Display window is used to assign visual attributes, such as bold text, text color, highlight color, percent bars, or an image, to a query column. The various visual attributes can be assigned based on specified conditions being met.
To assign visual attributes to a row in the query data list, see Row Display Option.
To invoke the Query Column Display window, follow these steps:
|
|
1. |
In the Query Definition window, click on a column in the Columns list and then select the Column Options toolbar button. |
|
|
2. |
In the Column Options window, click the Define button (next to Method under the Display Option heading). |
Alternatively, invoke the Query Column Display window by clicking the Define button in the Query Formula Definition window when adding or modifying a formula.
This window consists of the following:
|
Display Value |
Value that will be displayed in the column. (The exception is if an image is to be displayed instead.) | ||||||||||||||||||
|
Display Method |
The following methods are available to assign various visual attributes to a column:
Note:
| ||||||||||||||||||
|
Parameter Values |
In addition to the Display Value, which is the default parameter value, you can specify other query fields as parameters if they are to be used as part of a condition or display string. To Add a Parameter: Click the Add button (next to Parameter Values) and then click the drop-down arrow at the right of the newly-allotted parameter to select a field from the list, or define field characteristics (i.e. field number, offset, length) for manual fields. Formulas must be named to be included as additional parameters. See Query Formula Definition. Each parameter is assigned an ID (such as %1, %2, etc.) that is to be used in a condition and display string expressions rather than the actual name of the field. To Remove a Parameter: Select the parameter entry to be deleted and then click the Remove button (next to Parameter Values). To select multiple entries, use Shift-Click (consecutive selections) or Ctrl-Click (random selections). Prior to deleting, a message will display. | ||||||||||||||||||
|
Condition |
Set conditions for the assigned visual attribute(s). Conditions consist of PxPlus expressions that can be evaluated to zero/non-zero, but using the ID placeholder in the place of a field name; e.g. %1="Y". To Add a Condition: Click the Add button (below Condition grid) and then enter the condition. Multiple conditions can be defined, each with its own assigned display setting (i.e. color, image, etc.). Conditions are evaluated in the order in which they appear until a condition evaluates as true (i.e. non-zero). This means that if two conditions are set, %1<10 and %1<100, then values less than 10 will be assigned the first display setting, and values from 10 to less than 100 will be assigned the second display setting. Values that fall outside of the range of the specified conditions may or may not have an assigned display setting. To assign a setting to these values, simply add a blank condition at the end and assign a display setting. Otherwise, no display setting will be assigned, and default text and color will be used for these values. Use the Move Up/Move Down buttons (below Condition grid) to change the order of the conditions. To Remove a Condition: Select the condition entry to be deleted and then click the Remove button (below Condition grid). To select multiple entries, use Shift-Click (consecutive selections) or Ctrl-Click (random selections). Prior to deleting, a message will display. | ||||||||||||||||||
|
Color |
(Display Method is Colors, HiLiteColor, PercentBar, PercentBarWithLabel or TextColor) To assign a color to a condition, click the dotted button at the right of the Color cell to launch the Color Selections window. In the case of the PercentBar and PercentBarWithLabel methods, the assigned Bar Color will be the color of the top of the bar with an optional Gradient Color for the bottom. (If a gradient color is omitted, the bottom of the bar will be shaded.) Note:
| ||||||||||||||||||
|
Max Value |
(Display Method is PercentBar or PercentBarWithLabel) By default, a column value of 100 causes PercentBar to fill the entire width of the column, a column value of 50 fills half of the column width, and a column value of 0 (zero) displays no bar. You can also specify a different Max Value, which is used as the value to determine when the entire column width is to be filled. Example: A Max Value of 150 causes PercentBar to fill the entire width of the column when the column value is 150. When the value is 100, two-thirds of the column width is filled, and so on. Values that are greater than the Max Value are truncated. When using a PercentBarWithLabel display, the Max Value fills only three-quarters of the column width with the remaining one-quarter of the width for the label. (Max Value was added in PxPlus 2017.) | ||||||||||||||||||
|
Image |
(Display Method is Image) To assign an image to a condition, click the dotted button at the right of the Image cell to launch the Bitmaps window to select a particular bitmap. You can also specify an expression by selecting the Exp check box and entering an expression using placeholder IDs. | ||||||||||||||||||
|
Display String |
(Display Method is User) Display strings allow greater flexibility when assigning display attributes for particular conditions; e.g. you can mix bold text and background color. Display strings are PxPlus expressions; therefore, select the Exp check box and enter the expression to use. Example: '_COLOR'("Light Yellow")+'BB' Note: |
You can also create your own display methods by creating your own column display class. The existing methods are in the *obj/qrycoldsp class. Create your own class and inherit the *obj/qrycoldsp class in yours by using LIKE "*obj/qrycoldsp" in its definition. Then incorporate your new methods. Set %NOMADS'Query_ColumnDisplay$ to the name of your class, and your new methods will become available.
Below are examples of setting up column display scenarios:
|
Description |
Method |
|
Example 1: For the BALANCE column, you want to display negative values using Red text and high values (10000 or greater) using Green text. The rest are to display using the default text color. |
To do this: Assign TextColor as the Display Method to the BALANCE column. BALANCE is the default Parameter. It is assigned an ID of %1. Then create two Conditions: %1<0 %1>=10000 For the first Condition, assign Light Red as the Color, and Dark Green for the second Condition. |
|
Example 2: Your query has the following columns: CUSTOMER_NAME$ You want to display the CUSTOMER_NAME$ value in bold text if CUSTOMER_CLASS$ contains the value "VAR". |
To do this: Assign BoldText as the Display Method to the CUSTOMER_NAME$ column. The condition is based on the CUSTOMER_CLASS$ column; therefore, add CUSTOMER_CLASS$ to the list of Parameter Values. It is assigned an ID of %2. Then create the Condition: %2="VAR" |
|
Example 3: You want to highlight the entire CLIENTID$ column with a Light Green custom background color. |
To do this: Assign HiLiteColor as the Display Method to the CLIENTID$ column. Leave the Condition blank. Select your custom color in the Color Selections window. |
|
Example 4: Given a salesperson's yearly sales and sales target, you want to display a PercentBarWithLabel showing the percentage of the target that was achieved by each salesperson. In addition, you want to display a Gold bar if the salesperson outperformed their target. |
To do this: Create a formula to calculate the percentage of the sales target the salesperson achieved: 100*SMN_YR_SALES/SMN_YR_TARGET Set a format for the formula such as ##0.0%. Click the Define button to select a Display Option. For the Display Method, select PercentBarWithLabel. To create a Gold bar for the salespersons achieving more than their sales target, enter %1>100 as the Condition. For the Bar Color, assign a color such as RGB:225 210 30. For the remaining salespersons, add a second blank Condition with a Bar Color of your choice. (Example 4 using the PercentBarWithLabel method was added in PxPlus 2017.) |
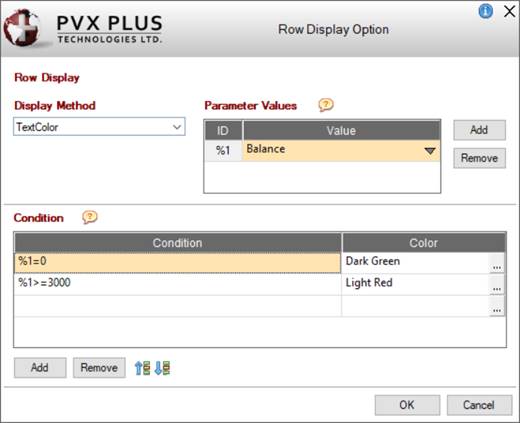
To invoke the Row Display Option window, in Query Header Definition on the Display tab, click the link Add (Edit) row display option (under the Row Highlight heading).
(The Row Display Option window was added in PxPlus 2021.)
This window consists of the following:
|
Display Method |
The following methods are available to assign various visual attributes to a row:
| ||||||||||||
|
Parameter Values |
Specify the query fields that are to be used as part of a condition. To Add a Parameter: Click the Add button (next to Parameter Values) and then click the drop-down arrow at the right of the newly-allotted parameter to select a field from the list, or define field characteristics (i.e. field number, offset, length) for manual fields. Formulas must be named to be included as additional parameters. See Query Formula Definition. Each parameter is assigned an ID (such as %1, %2, etc.) that is to be used in a condition rather than the actual name of the field. To Remove a Parameter: Select the parameter entry to be deleted and then click the Remove button (next to Parameter Values). To select multiple entries, use Shift-Click (consecutive selections) or Ctrl-Click (random selections). Prior to deleting, a message will display. | ||||||||||||
|
Condition |
Set conditions for the assigned visual attribute(s). Conditions consist of PxPlus expressions that can be evaluated to zero/non-zero, but using the ID placeholder in the place of a field name; e.g. %1="Y". To Add a Condition: Click the Add button (below Condition grid) and then enter the condition. Multiple conditions can be defined, each with its own assigned display setting (i.e. color, image, etc.). Conditions are evaluated in the order in which they appear until a condition evaluates as true (i.e. non-zero). This means that if two conditions are set, %1<10 and %1<100, then values less than 10 will be assigned the first display setting, and values from 10 to less than 100 will be assigned the second display setting. Values that fall outside of the range of the specified conditions may or may not have an assigned display setting. To assign a setting to these values, simply add a blank condition at the end and assign a display setting. Otherwise, no display setting will be assigned, and default text and color will be used for these values. Use the Move Up/Move Down buttons (below Condition grid) to change the order of the conditions. To Remove a Condition: Select the condition entry to be deleted and then click the Remove button (below Condition grid). To select multiple entries, use Shift-Click (consecutive selections) or Ctrl-Click (random selections). Prior to deleting, a message will display. | ||||||||||||
|
Color |
(Display Method is Colors, HiLiteColor or TextColor) To assign a color to a condition, click the dotted button at the right of the Color cell to launch the Color Selections window. Note: | ||||||||||||
|
Display String |
(Display Method is User) Display strings allow greater flexibility when assigning display attributes for particular conditions; e.g. you can mix bold text and background color. Display strings are PxPlus expressions; therefore, select the Exp check box and enter the expression to use. Example: '_COLOR'("Light Yellow")+'BB' Note: |
You can also create your own display methods by creating your own display class. The existing methods are in the *obj/qrycoldsp class. Create your own class and inherit the *obj/qrycoldsp class in yours by using LIKE "*obj/qrycoldsp" in its definition. Then incorporate your new methods. Set %NOMADS'Query_ColumnDisplay$ to the name of your class, and your new methods will become available.
Below are examples of setting up row display scenarios:
|
Example 1: Your query has a BALANCE column. Based on its value, you want the row to display using Red text if the value of BALANCE is negative and Green text if the value is 10000 or greater. The remaining rows are to display using the default text color. |
To do this: Assign TextColor as the Display Method. The conditions are based on the BALANCE column; therefore, select BALANCE from the drop-down list of Parameter Values. It is assigned an ID of %1. Then create two Conditions: %1<0 %1>=10000 For the first Condition, assign Light Red as the Color, and Dark Green for the second Condition. |
|
Example 2: Your query has a CUSTOMER_CLASS$ column. You want to display a record in bold text if CUSTOMER_CLASS$ contains the value "VAR". |
To do this: Assign BoldText as the Display Method. The condition is based on the CUSTOMER_CLASS$ column; therefore, select CUSTOMER_CLASS$ from the drop-down list of Parameter Values. It is assigned an ID of %1. Then create the Condition: %1="VAR" |
Query Header
Query Definition
Invoking a Query