|
*OBJ/CHART |
Plus Charting Utility |
The Plus Charting utility provides a simple means to display charts on the screens or print file. These charts will use the same charting engine as the Plus Charts, which are available starting with PxPlus 2019. It provides the following types of charts: 2D Charts, 3D Charts and Miscellaneous Chart Types (i.e. Gauge and Scatter).
(The Plus Charting utility was added in PxPlus 2019.)
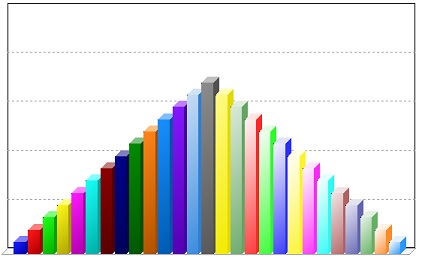
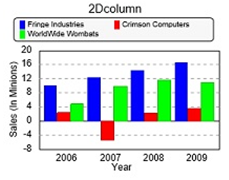
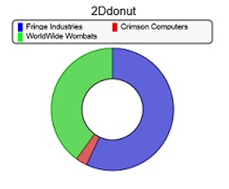
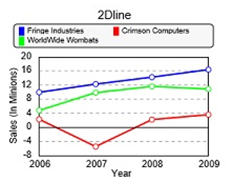
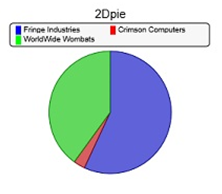
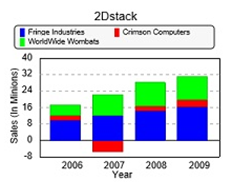
The 2D chart types are displayed below: 2D Area, 2D Bar, 2D Column, 2D Donut, 2D Line, 2D Pie and 2D Stack.
|
|
|
|
|
|
|
|
|
|
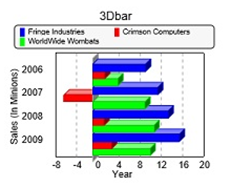
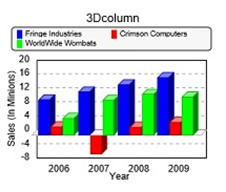
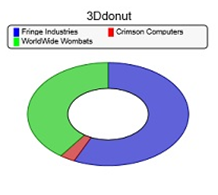
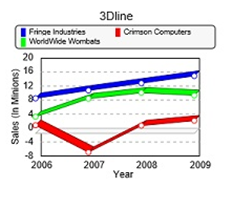
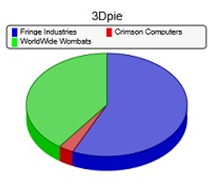
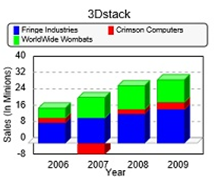
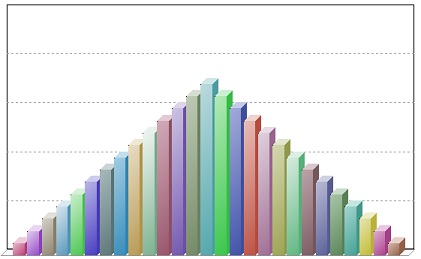
The 3D chart types are displayed below: 3D Bar, 3D Column, 3D Donut, 3D Line, 3D Pie and 3D Stack.
|
|
|
|
|
|
|
|
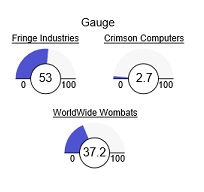
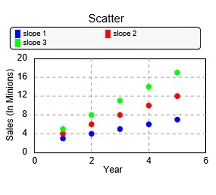
Miscellaneous Chart Types
The miscellaneous chart types are displayed below: Gauge and Scatter.
|
|
|
To draw a chart, you create a *obj/chart object, load your data and set the appropriate properties, such as the type of chart (set in the 'Fmt$ property), titles and legends. Once these are set up, you can issue a 'Draw( ) method call passing the channel and position (column, line, width and height) in which you want the chart drawn.
Select the chart type you want (from the types shown above) and prefix it with the character 2D or 3D to indicate the desired type of output. Place this value in the 'Fmt$ property. If you select a 3D chart and there is no rendering engine for the chart (such as 3DArea), the system will try to render using a 2D version. Some charts (Gauge and Scatter) do not need the 2D/3D prefix.
If the desired chart type is not available, the system will default to a 2D column chart.
Use these links to access coding examples provided below:
Example - Simple Column Chart for Revenue
Example - Program to List All 2D/3D Chart Types to a PDF
Example - Sample Program to Create a Web Page with the Chart
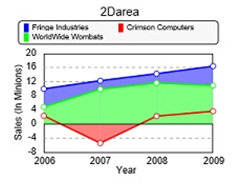
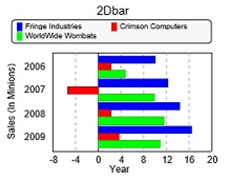
Charts generally consist of a series of point values, which may be grouped into multiple sets. By default, the point values are drawn on the chart grouped by sets with each having a different color. For example, you might have four point values representing sales for the last four years and these may be grouped by a client. In this case, each set of points would represent a specific client's sale for the past four years. This type of arrangement can be seen in the Bar and Column charts shown above.
For some charts, such as Pie, Donut or Gauge, the value displayed will represent the aggregate total of the point in a set. It should be noted that the Pie and Donut charts cannot represent negative values; thus, they will display a warning should the sum of any of the data points in a set result in a negative number.
Each point in a set can be given a Name, which will be displayed in the chart below or beside the points. In the sample charts above, the point names of "2006", "2007", "2008" and "2009" are assigned to the four points being charted.
Gauge charts display each set of data provided as a gauge, which by default ranges from 0 to 100. This range can be changed by setting RangeMax and RangeMin properties. By default, the current value is shown as a blue band. The color of the band can be changed dynamically by specifying Green, Yellow and Red settings defining ranges where the color will change. For example, if you set the redFrom property to 80 and the redTo property to 100, the band will go red should the value be >= 80.
Scatter charts are different in that they require two point values for each point. The first value is the 'X' value and the second is the 'Y'; thus, you need to pass twice the number of values as there are points when drawing a Scatter chart.
By default, the system will assign a different color to each set of points displayed. There is an internal table of colors that will be used to display the columns. If desired, you can change the color used on a set-by-set basis by setting the 'CurrentSet property to the desired set and loading the 'TextColor$ property with the color you wish to use.
The following chart shows the default chart colors:
If desired, you can select an alternate set of pastel colors by setting the 'PastelPalette property to non-zero value. These colors are shown below:
Additionally, if desired and you only have one set of data, you can set the 'ColorByPoint property, and the chart will render each point in the set with a different color as if each point was its own dataset.
The following properties are supported:
|
Property |
Description | ||||||||||
|
Animate |
Controls the animation of a Web/HTML rendered chart. When this property is set (non-zero) and the chart is first rendered, Bars and Columns grow from the zero line to full size, and all other charts are set to fade in when rendered. Only the chart contents are animated (not the frame, titles or set/point names) and only when rendered as HTML for use on the Web. | ||||||||||
|
BackColor$ |
Background color for the complete chart area. | ||||||||||
|
Bitmap$ |
Bitmap to appear as the background for the chart. Generally, this image will be scaled to cover the region. For all but PDF output, the system will retain the aspect ratio while cropping any excess imagery that will not fit. Note: | ||||||||||
|
Border |
When this property is set, the chart will be drawn with a thin black border around the outside of the defined area. | ||||||||||
|
List of colors to apply when plotting the different datasets of a chart. Color references may include PxPlus colors (e.g. Light Red, Dark Blue), RGB colors (e.g. RGB:130 0 130), User-defined colors (e.g. Color20) or Expressions (e.g. =myColor$). The colors are separated by a separator character that is the last character of the list. Example: Below is a sample color string: "Light Red;RGB:100 100 45;=myColor$;Color19;" See Colors for information on controlling the colors used for chart datasets. (The ChartColors$ property was added in PxPlus 2020.) | |||||||||||
|
When this property is set (non-zero) and there is only one set of data, the system will draw each point in a different color as if each point was a set. | |||||||||||
|
ConnectorLine |
(Applicable for Column and Bar Charts Only) When this property is set (non-zero), the system will draw lines between the ends of the columns or bars for each point/set in the chart. | ||||||||||
|
Currency |
Indicates whether or not to display currency symbols. | ||||||||||
|
Current point number being referenced. | |||||||||||
|
Current set number being referenced. | |||||||||||
|
DecimalPrecision |
Number of digits to display after the decimal point. (Default is 2. Maximum is 6.) | ||||||||||
|
Can be set to the default color to use for all text and non-chart lines (border, chart frame, etc.). If not set, Black will be used. | |||||||||||
|
DisplayFormat$ |
PxPlus numeric format to use when displaying numbers. If formatting fails, the system will default to its internal format. | ||||||||||
|
Color of the back pane of the chart. | |||||||||||
|
FaceColorBottom$ |
Color used on the zero ledge on 3D charts. | ||||||||||
|
FaceColorLeft$ |
(Not currently used but provided for compatibility with original PxPlus chart control) | ||||||||||
|
Type of chart to display (e.g. 2DBar, 3DColumn, Gauge, etc.). Setting this to an invalid chart type will result in a 2DColumn chart being presented. | |||||||||||
|
Font$ |
Font to use for the text in the chart. | ||||||||||
|
FontColor1$ |
Color of the text on the main title. This color takes precedence over DefaultColor$ for the main title. | ||||||||||
|
FontColor2$ |
Color of the text for point names, values and all titles and legends except the main title. This color takes precedence over DefaultColor$. | ||||||||||
|
Footer$ |
Chart footer (text displayed centered below the chart). This is suppressed if there is no room to display. | ||||||||||
|
FormatNumberScale |
Boolean value indicating whether to display numbers with formatted scale (e.g. 4.5K or 1.2M) or as full numbers (e.g. 45,000 or 1,200,000). Default is to use a formatted scale (1). | ||||||||||
|
IndexMode |
(Not currently used but provided for compatibility with original PxPlus chart control) | ||||||||||
|
LabelLocation$ |
(Not currently used but provided for compatibility with original PxPlus chart control) | ||||||||||
|
LegendLocation$ |
Location of chart legend. Possible values are Top, Bottom, Left, Right, TopLeft, TopRight, BottomLeft, BottomRight and None. | ||||||||||
|
LegendText$ |
Legend text for a dataset. | ||||||||||
|
MarginBottom |
Set the number of lines for the bottom chart margin. | ||||||||||
|
MarginLeft |
Set the number of columns for the left chart margin. | ||||||||||
|
MarginRight |
Set the number of columns for the right chart margin. | ||||||||||
|
MarginTop |
Set the number of lines for the top chart margin. | ||||||||||
|
Margins$ |
Set all chart margins. Use syntax "top:bottom:left:right" or "AUTOMATIC" to set margins to the automatic (default) mode. Example: x'margins$="10:10:20:10" | ||||||||||
|
When this property is set (non-zero), suppresses the small dots that mark the data points on Area and Line charts. (NoChartDots property for Plus Charts was added in PxPlus 2023.) | |||||||||||
|
NoUpdate |
Can be set when using object as a control to disable screen updates while properties are being set/changed. | ||||||||||
|
NumPoints |
Largest number of data points within dataset. | ||||||||||
|
NumSets |
Total number of datasets. | ||||||||||
|
When this property is set (non-zero), the system will use a different set of more pastel colors to display the charts. | |||||||||||
|
PointText$ |
Point label values. Single string of point label values where the last character is the delimiter. | ||||||||||
|
Proportions2M |
(Not currently used but provided for compatibility with original PxPlus chart control) | ||||||||||
|
ProportionDW |
(Not currently used but provided for compatibility with original PxPlus chart control) | ||||||||||
|
ProportionHW |
Used to determine the ratio of the chart height to width when drawing responsive HTML charts. A value of 1 indicates the width and height should be considered the same; .56 works out to a roughly 9/16 aspect ratio. Note: | ||||||||||
|
Set ceiling value of the Y-axis. The chart view will be adjusted according to RangeMin and RangeMax values. If omitted (same as RangeMin), the chart will compute reasonable values based on the data supplied. | |||||||||||
|
RangeMin |
Set floor value of the Y-axis. The chart view will be adjusted according to RangeMin and RangeMax values. If omitted (same as RangeMax), the chart will compute reasonable values based on the data supplied. | ||||||||||
|
RangeText$ |
(Not currently used but provided for compatibility with original PxPlus chart control) | ||||||||||
|
Separator character between each data point used for the Load( ) method. | |||||||||||
|
SepLoad$ |
Separator character for each dataset. Should be the last character of data passed to the Load( ) method. | ||||||||||
|
ShowValues |
When this property is set (non-zero), the system will display the actual point values on the chart as follows:
| ||||||||||
|
Foreground text color. | |||||||||||
|
Primary chart title. | |||||||||||
|
Title2$ |
Secondary chart title. | ||||||||||
|
Value |
Value for the point currently selected by setting the CurrentPoint and CurrentSet properties. | ||||||||||
|
XAxisLocation$ |
X-Axis location (Back or Bottom). | ||||||||||
|
XAxisTitle$ |
X-Axis title. | ||||||||||
|
YAxisLocation$ |
Y-Axis location (Back or Left). | ||||||||||
|
YAxisTitle$ |
Y-Axis title. | ||||||||||
|
ZAxisLocation$ |
(Not currently used but provided for compatibility with original PxPlus chart control) | ||||||||||
|
ZAxisTitle$ |
(Not currently used but provided for compatibility with original PxPlus chart control) | ||||||||||
|
greenFrom |
(Applicable for Gauge Charts Only) Numeric value where the gauge will start turning green. | ||||||||||
|
greenTo |
(Applicable for Gauge Charts Only) Numeric value where the gauge will stop turning green. | ||||||||||
|
majorTicks$ |
(Not currently used but provided for compatibility with original PxPlus chart control) | ||||||||||
|
minorTicks |
(Not currently used but provided for compatibility with original PxPlus chart control) | ||||||||||
|
(Applicable for Gauge Charts Only) Numeric value where the gauge will start turning red. | |||||||||||
|
(Applicable for Gauge Charts Only) Numeric value where the gauge will stop turning red. | |||||||||||
|
yellowFrom |
(Applicable for Gauge Charts Only) Numeric value where the gauge will start turning yellow. | ||||||||||
|
yellowTo |
(Applicable for Gauge Charts Only) Numeric value where the gauge will stop turning yellow. |
The following methods are available and perform comparable functionality to the standard CHART directives:
|
Method |
Description |
|
Clear( ) |
This method clears all of the data values from the chart but leaves the titles and labels. |
|
CreateImage(path$,width,height) |
This method will create an image of the chart on the designated path$. The system will generate a .png, .jpg or .bmp file based on the suffix of the file name. Note: |
|
Delete( ) |
This method clears all of the data values and all of the titles from the chart. |
|
Draw(channel,col,line,cols,lines) |
This method is called to physically draw the chart onto the channel and location specified. Note: |
|
Find(set,point,numVar) |
This method returns the current value for the specified set/point in numVar. |
|
Find(set,point,strVar) |
If 'set' is non-zero, this method returns the set name/title. |
|
GetCSS$( ) |
This method returns the CSS styling required to render a chart. If planning to include a chart in a Web page, you need to also include the CSS returned by this function. |
|
GetHTML$(width,height,fontWd,fontHi) |
This method will return the HTML 'div' required to draw the current chart with the specified width and height (in pixels). |
|
GetPage$(width,height,title$) |
This method will return the full HTML page that can be used to display the chart. The chart size will be used and centered in the resultant page. If the width and height are both zero, the chart will be created to be responsive to changes in the browser width with the height. |
|
Load(string) |
This method can be used to load data into a chart. The last character in the string identifies the separator for each dataset, while the value defined by SEP= when the chart is created is used to identify the different data points within each dataset. Legend labels can be specified as the first element in a dataset definition followed by an = (equals sign). Example: This example loads a chart with two datasets consisting of four points (or data elements): This next example includes legend labels for the first example: |
|
Write(set,point,numValue) |
This method sets the current value for the specified set/point. |
|
Write(set,point,strValue) |
If 'set' is non-zero, this method updates the set name/title. |
print 'CS',
oChart=new("*obj/chart" for program)
oChart'Fmt$="3dColumn"
oChart'title1$="Annual Revenue"
oChart'Sep$=","
oChart'yAxisTitle$="Sales (In Millions)"
oChart'xAxisTitle$="Year"
oChart'Load("Fringe Industries=10234,11129,12980,16465/")
oChart'PointText$="2006/2007/2008/2009/"
oChart'Draw(0,5,5,40,15)
drop object oChart
begin
open (1)"*pdf*;view;margins=250:250:250:250;orientation=Landscape"
print (1)'font'("Arial",-9),'DF',
col=5,line=5,wd=40,hi=18
maxCol=mxc(1)-wd
!
oChart=new("*obj/chart" for program)
oChart'Fmt$="3dColumn"
oChart'Sep$=","
oChart'yAxisTitle$="Sales (In Minions)"
oChart'xAxisTitle$="Year"
oChart'Load("Fringe Industries=10,12.3,14.3,16.4/Crimson Computers=2.3,-5.4,2.2,3.6/WorldWide Wombats=4.8,9.9,11.6,10.9/")
oChart'PointText$="2006/2007/2008/2009/"
!
print (1)"2D Charts..."
gosub Do_all with type$="2d"
!
print (1)'FF',"3D Charts..."
gosub Do_all with type$="3d"
!
drop object oChart
end
!
Do_all:
col=5,line=5,wd=40,hi=18
select f$ from "*obj/chart" where mid(f$,1,2)=type$ and mid(f$,-4)=".pvc"
f$=arg(f$,1,".")
gosub Do_Chart
next record
return
!
Do_Chart:
oChart'Fmt$=f$
if f$(2,1)="D" \
then oChart'title1$=ucs(f$(1,2))+cvs(f$(3),256) \
else oChart'title1$=cvs(f$,256)
oChart'Draw(1,col,line,wd,hi)
col+=wd+4
if col>maxCol \
then col=5,line+=hi+2
return
oChart=new("*obj/chart" for program)
oChart'Fmt$="3dArea" ! "3dColumn"
oChart'title1$="Revenue top Clients"
oChart'Sep$=","
oChart'yAxisTitle$="Sales (In Millions)"
oChart'xAxisTitle$="Year"
oChart'Load("Fringe Industries=10,12.3,14.3,16.4/Crimson Computers=2.3,-5.4,2.2,3.6/WorldWide Wombats=4.8,9.9,11.6,10.9/")
oChart'PointText$="2006/2007/2008/2009/"
x$=oChart'GetPage$(800,600,"Revenues")
open create purge (hfn)"revenue.html"
write record (lfo)x$
close (lfo)
system_help "revenue.html"
drop object oChart
NOMADS Chart Control
Charting Alternatives in PxPlus
NOMADS AutoChart
Smart Chart
Chart Images Generation
Chart Image Utilities