|
Define the Contents of the Chart |
|
The first step is to define the appearance and the contents of the chart. This can be done by creating an AutoChart definition based on a Query+ definition or by writing a program that creates the chart and its contents.
Chart appearance is also dependent upon the currently selected chart brand. The chart brand is set up by using the %NOMADS'Chart$ property in NOMADS, and in iNomads, it is set in the iNomads Configuration. Only Plus, Google and RGraph Charts can be generated on a Windows server. Only Plus Charts are supported on Linux.
See Charting Alternatives in PxPlus.
The AutoChart definitions that are used to generate chart images are based on the Query+ interface. The query definition defines the columns and the data required to generate the chart. You can use existing definitions or design a definition exclusively for generating the chart. See Defining a Query.
After the query has been defined, you can create the AutoChart Definition, which defines the parameters for the chart. This can be done using one of the following methods:
|
Method |
Description |
|
Select the Define Chart button on the Query Definition toolbar. |
This invokes the Chart Wizard that will step you through the process of creating, editing or deleting a chart definition. Note: |
|
Define the AutoChart at run time. |
Run the query either from the NOMADS Panel Designer on the Library Object Selection window or from the Query Definition window by clicking the Test button, or invoke the query from within your application. At run-time, click the Charts button at the top of the query or select Charts from the right-click popup menu. Then, select Define a Chart to invoke the Chart Wizard. |
|
Select the Smart Load button when defining a NOMADS Chart control. (The Smart Load button for NOMADS Chart controls was added in PxPlus 2019.) |
This invokes the Smart Chart Definition window, which includes additional Chart Selection options. |
AutoChart definitions associated with queries are limited in the complexity of the data analysis and display attributes. An alternate method is to create and generate chart images using the PxPlus chart class and image generation utility.
Simply instantiate the Plus, Google or RGraph Chart object, set chart properties as desired, then generate and load the chart data. The chart class has a method for generating an HTML page, which, when saved to a file, can be passed to the *TOOLS/HTMLIMAGE utility to generate the image.
Example:
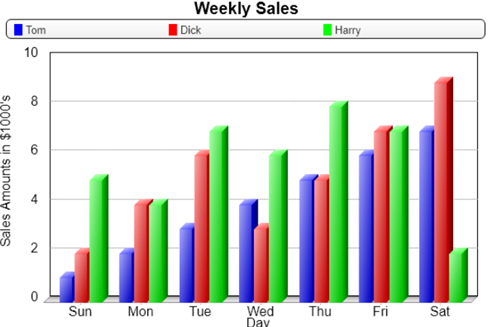
This chart was generated using the code illustrated below.
! Generate a chart image
!
! Instantiate the chart class
chartBrand$="plus" ! could also be "rgraph" or "google"
c=new("*plus/inomads/add-ons/charts/"+chartBrand$+"/chart")
!
! Set chart properties
c'fmt$="3dcolumn"
c'title1$="Weekly Sales"
c'xAxisTitle$="Day"
c'yAxisTitle$="Sales Amounts in $1000's"
c'rangemax=10
!
! Load the chart data
c'sep$=","
salesData$="Tom=1,2,3,4,5,6,7;Dick=2,4,6,3,5,7,9;Harry=5,4,7,6,8,7,2;" ! sample data
c'load(salesData$)
c'pointText$="Sun,Mon,Tue,Wed,Thu,Fri,Sat,"
!
! Set the size (in pixels) of the html page and generate it
imgWidth=600
imgHeight=400
html$=c'HTML_Page$(imgWidth,imgHeight)
!
! Finished with the object
drop object c
!
! Create a temporary serial file and load it with the code for the html page
serial "chart.htm",err=*next
open purge (hfn,isz=-1,err=Done)"chart.htm"
htmlfile$=pth(lfo)
write record (lfo)html$
close (lfo)
!
! Set the name for the image file, including image suffix (e.g. .png,.gif,.jpg)
imgPath$="chart.png"
!
! Call the utility to generate the image
call "*tools/htmlimage",err=*next,htmlfile$,imgPath$,imgWidth,imgHeight
!
! Erase the temporary html file
erase htmlfile$,err=*next
!
system_help imgPath$ ! debug line - remove from live system
!
Done:
end