|
Report Wizard |
The Report Wizard provides a quick and simple way to create a report that does not require any special formatting. The wizard walks you through a series of eight Steps that result in the creation of a new report definition. When the definition is complete, you can preview the results and revisit any steps. When you exit the wizard, the definition is loaded into the Report Designer where you can customize it and make final adjustments before saving it.
To invoke the Report Wizard, use one of the following methods:
|
Location |
Method |
|
From the PxPlus IDE Main Launcher |
Expand the Report Writer category and select Report Wizard. |
|
From the Report Designer menu bar |
From the File menu, select Report Wizard. The current report is cleared from the Report Designer (if applicable), and the wizard Welcome Panel is launched. |
|
From the Report Designer tool bar |
Select the Report Wizard tool bar button. The current report is cleared from the Report Designer (if applicable), and the wizard Welcome Panel is launched. |
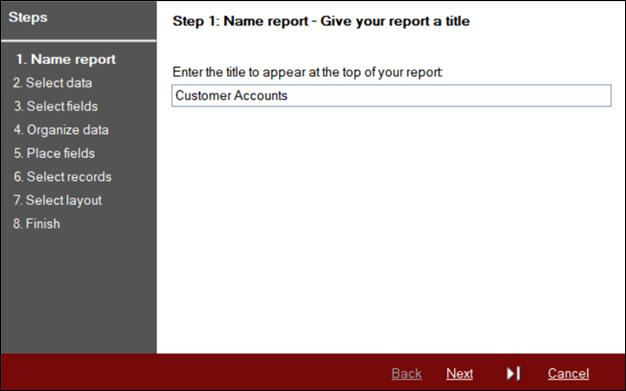
Give your report a title.
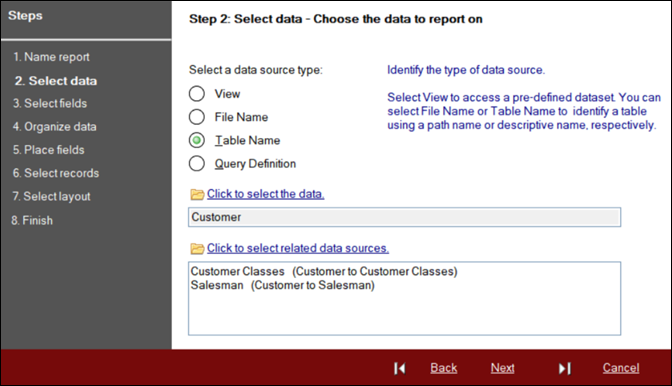
Choose the data to report on.
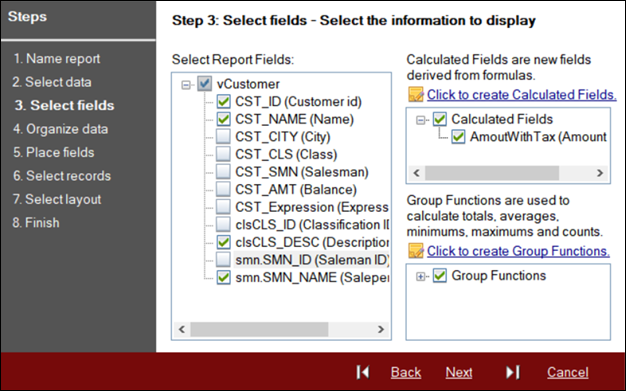
Select the information to display. Create calculated fields and group functions.
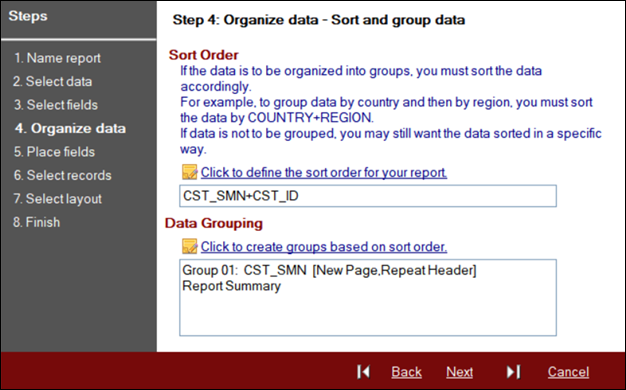
Sort and group the data.
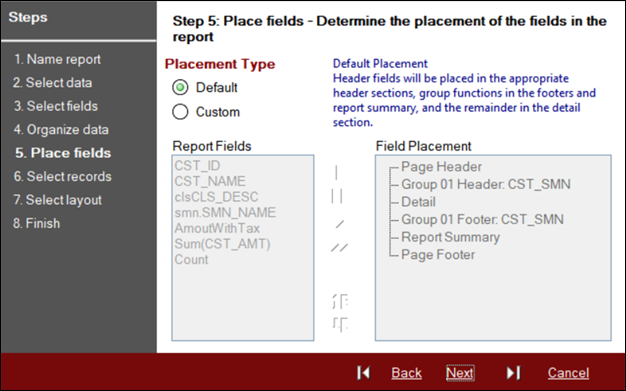
Determine the placement of the fields in the report.
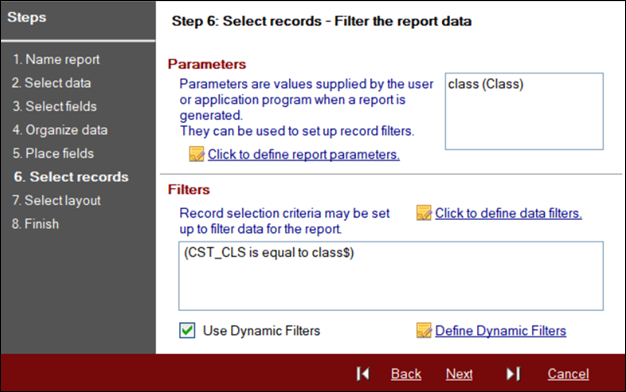
Filter the report data.
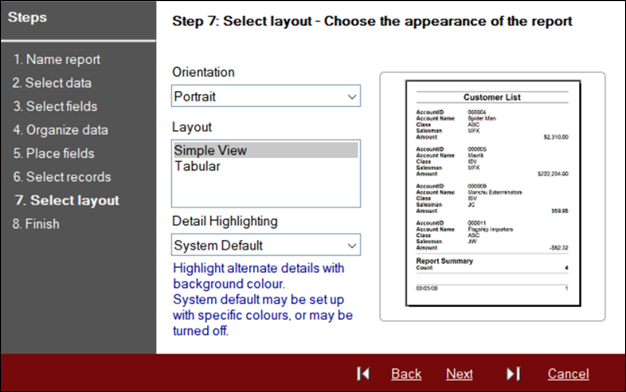
Choose the appearance of the report.
Select the default output destination for the report. Complete the Report Wizard and generate the report definition.
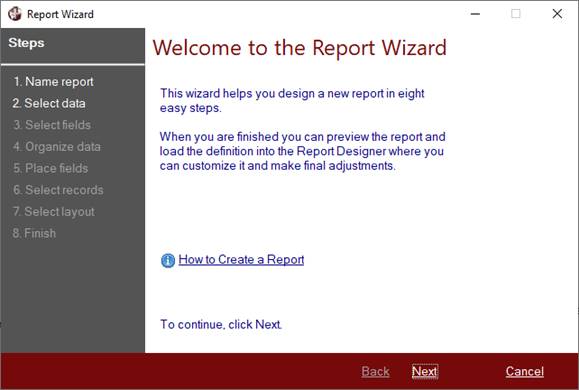
Invoking the Report Wizard displays the Welcome panel, which provides a How to Create a Report link that launches PxPlus Help documentation.
Click Next to proceed to the first step. Each step in the wizard presents a panel made up of three main sections:
|
Image Bar (left side) |
Displays the eight steps for designing a new report.The list of steps is clickable, allowing you to jump ahead and back to navigate through the wizard without having to go through the intermediate steps. Some steps, however, do require others to be performed first before you are able to advance. The image is changeable by setting the %RW_WIZARD_IMAGE$ variable to the path of the image to be displayed. This allows you to create your own look for the wizard. | ||||||||||||
|
Work Area (right side) |
Body of the wizard panel that consists of fields used to process each step. | ||||||||||||
|
Navigation Bar (bottom) |
Consists of buttons that are shown/hidden or enabled/disabled, depending on the step being defined:
|
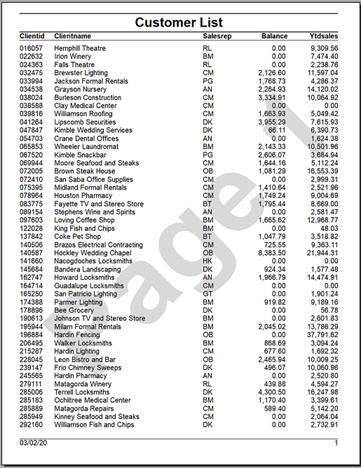
Enter the title of the report to be used on the page header (e.g. Customer Accounts).
Identify the type of data source, and then select the Click to select the data hyperlink button to choose the actual input source. See Input Source.
If a report requires data from multiple related files, you can use a View or a Query Definition as the input source. See Query Definition.
If the main data source type is a File Name or Table Name, additional related data sources may be available for selection by clicking the associated button. See Related Data Sources.
Select the fields from the input source to display in the report. Click the check box adjacent to each field, or to select all the fields, click the check box adjacent to the name of the input source (e.g. vCustomer).
You can create Calculated Fields, which are new fields derived from formulas.
In addition, Group Functions can be created to calculate totals, averages, minimums, maximums and count.
Determine how the data is to be sorted for the report. If the data is to be organized into groups, you must sort the data accordingly. For example, to group data by country and then by region, you must sort the data by Country + Region, and then create groups based on that sort order.
If the data is not to be grouped, you may still want the data sorted in a specific way. The default is to sort by the primary key of the data source.
See Sort Sequence and Grouping the Data.
Determine the placement of fields in the report in terms of placement in different sections, such as details, or group headers and footers, etc. In addition, determine the order of the fields within a section.
Select the Placement Type (Default or Custom):
|
Default |
Header fields will be placed in the appropriate group header sections, group functions in the group footers and report summary, and the remaining fields in the detail section. |
|
Custom |
Custom placement allows you to select report fields and place them in the appropriate section in the Field Placement list. One or more selected fields can be moved by dragging from the Report Fields list to the Field Placement list or by using the Add, Add All, Remove or Remove All buttons. Once fields are placed, the field order can be changed within a section by using the Move Up and Move Down buttons. |
Filter the report data. Define Parameters and Data Filters for selecting the records to appear in the report.
(Support for defining Dynamic Filters was added in PxPlus 2022.)
Parameters are values supplied by the user or application program when a report is generated, such as a start and stop date. They are often used to set up record selection criteria for filtering the data.
Determine the layout of the report.
Select the Orientation and Layout for the report. The two types of layouts are:
|
Simple View |
Presents each field on a separate line with a field description on the left and the field value on the right. |
|
Tabular |
Presents the data in table form with field names as column headers and the field values in the columns. |
The Detail Highlighting option is used to highlight alternate report details with background color. See Colours for information on setting the system defaults for this option.
|
|
|
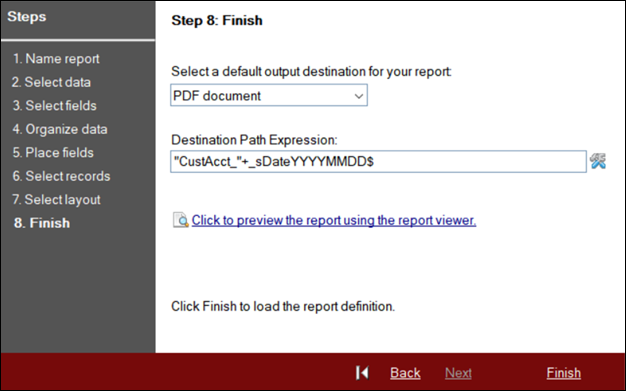
Select a default output destination for the report from the drop down list: Clipboard, HTML document, PDF document, Printer, Tab delimited file and Viewer.
The Destination Path Expression is used to generate a destination pathname for the output file created when a report is generated. The destination path is optional for single reports but is required for definitions that generate multiple reports.
(Support for Destination Path Expressions was added in PxPlus 2022.)
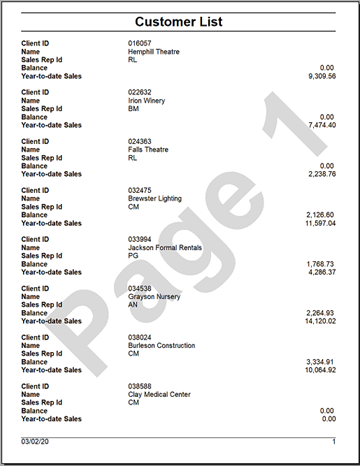
Prior to completing the wizard, select the Click to preview the report using the report viewer hyperlink button to view the results. You can go back to previous steps to make any necessary changes.
When done, click Finish. The resulting report definition will be loaded into the Report Designer where it can be modified and saved.